One of the most common and powerful tasks an HMI can handle is the logging of information (data) from connected devices such as PLCs, VFDs, sensors, etc. Logged information can be used to generate trend graphs, export records for analysis, and troubleshoot alarms or machine failures – ultimately supporting continuous improvement across operations.
Fortunately, setting up data logging with a Fuji Monitouch V10 HMI is straightforward and only takes a few clicks. In this blog, we will cover how to create a trend line that tracks the current draw of a Frenic Mini VFD spinning a motor. This is a great starting point for anyone looking to integrate meaningful data visualization into their HMI.
Data Logging on a Fuji Monitouch V10 HMI
To begin, open V-Sft 6 and load your HMI application. This application includes simple forward, reverse, and speed controls for the connected Frenic Mini VFD. Next, navigate to System Settings, then Logging Server to open the Logging Server configuration window.
Now click Add and then Complete to add a Logging Block with the specified number.


In this case, we want to change the Logging Method to Constant Cycle, leaving the Logging Time at “0” to log every process cycle.

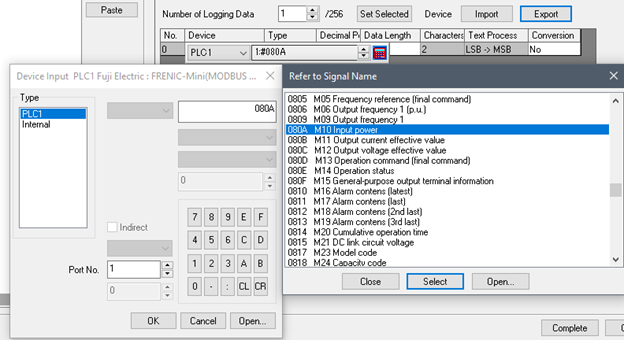
Now, double-click the entry in the Device column, select PLC1, and click the red button. On the Frenic VFD, the input power is in code M10. This will provide a good visualization of overtime change, so we will use it for the purpose of this demonstration.
To save the settings, click OK and then Complete.
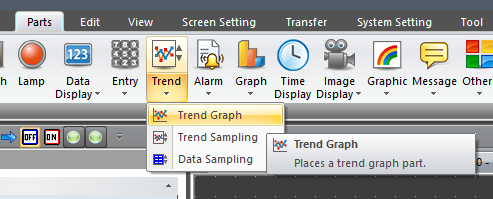
Next, following the steps shown in the snippet below, we will place a trend graph on the screen to visualize the data coming in.
Go ahead and place the graph on the screen and double-click it to open the detail settings.
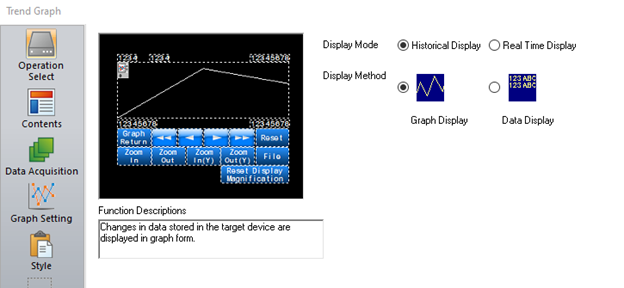
Let us start with Operation Select. We will be using a Historical Display, with a Graph Display.
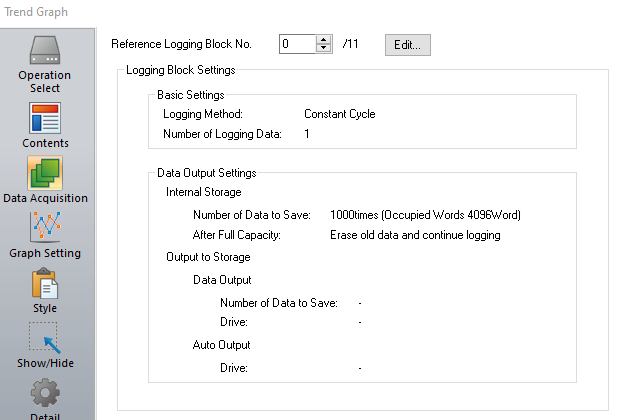
Now, in Data Acquisition, ensure that the Logging Block specified earlier is selected; in this case, it should display “0”.
In Graph Setting, set the Points to Display to the highest available value, as of V-Sft 6.2.6.0 it is 3840. It’s important to note that M10 is a percentage value with two decimal places. So 100% would mean 10000. This value is read as a signed integer so no decimal point is required.

For now, we will leave the style as the default.
With that done, let’s transfer the application to the HMI for testing.
Transferring the Application to Your HMI
Please note, it is expected that you will receive an SRAM error, and it will need to be formatted. So, when the error pops up, simply press the System button, locate Local Mode from the menu that has appeared, and then scroll down the left side until you see SRAM. Select it, press Format, and then Execute. This will clear all SRAM and activate the required amount. Note that this must be done whenever the amount of SRAM in use has changed.
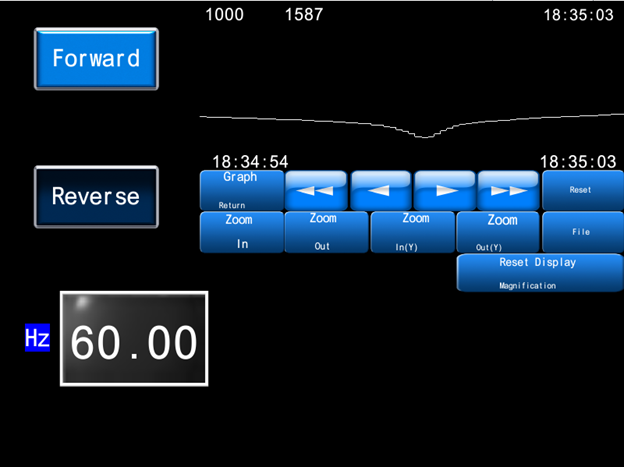
Now that it is open, you can start the VFD and see your graph go up and down based on the speed and load.
Thank you for reading our blog. To learn more and stay up to date on critical technology integration processes, click the subscribe button below and stay tuned for more.
Want to watch this process on video? Check it out on YouTube: From PLC to Trendline: Data Logging with Fuji Monitouch V10 HMIs
